How to debug CSP violations in Chrome DevTools
CentralCSP Team ·
Last update:
When a Content Security Policy (CSP) blocks something, the browser tells you in the console, and the message names both the resource it refused and the directive that did the refusing. The fastest way to debug a violation is to read that message, then open the DevTools Issues panel, which breaks the same violation into the blocked resource, the violated directive, the source location, and a link to the element that triggered it. From there you map the directive to the fix.
This post walks through reading the "Refused to..." console message, opening and using the Chrome DevTools Issues panel, the common messages you will see and what each one means, and how to turn a message into the directive change that fixes it. It ends with the one thing DevTools cannot tell you.
Read the console message first
The console line is the quickest signal. A blocked script produces something like this:
Refused to load the script 'https://cdn.example/widget.js' because it
violates the following Content Security Policy directive: "script-src 'self'".
Read it in three parts:
- The verb and resource. "Refused to load the script 'https://cdn.example/widget.js'" tells you what the browser blocked and its URL. The verb changes by type: "Refused to load", "Refused to execute inline script", "Refused to apply inline style", "Refused to connect to", "Refused to frame".
- The directive that blocked it. "violates the following Content Security Policy directive: script-src 'self'" is the rule that did not match. This is the directive you will change, or the one whose source list is missing the origin you need.
- The mode. If the message says the resource "would be blocked" or mentions report-only, the policy is on
Content-Security-Policy-Report-Onlyand nothing was actually blocked yet. An enforced policy says "Refused to" outright.
The console is enough for a quick read, but it does not always link you to the element or show the source cleanly. For that, use the Issues panel.
Use the Issues panel
The Issues panel turns each violation into a structured card instead of a one-line string. For one violation it shows:
- the violated directive (for example
script-src), - the blocked resource (the URL, or "inline" for inline code),
- the source location (the file and line that loaded the resource),
- a link to the element in the Elements panel that caused it.
To open it: click the Issues counter in the DevTools top action bar, or use More tools then Issues from the DevTools menu (the three-dot overflow). Reload the page with DevTools open so the violations are captured. The Issues panel groups identical violations, so a script blocked on every navigation shows once with a count, which is easier to scan than the repeated console lines.
The element link is the part that saves time. Click it and DevTools jumps to the exact <script>, <link>, <img>, or <iframe> that triggered the block, so you can see whether it is your code or an injected third party.
Common messages and what they mean
The verb in the message tells you the resource type, and the resource type tells you the directive. The frequent ones:
- "Refused to load the script ..." A script from a URL was blocked by
script-src(ordefault-srcas fallback). The origin is not on the source list. - "Refused to execute inline script ..." An inline
<script>or an inline event handler (onclick=...) was blocked becausescript-srchas no'unsafe-inline', nonce, or matching hash. This is the intended behaviour of a strict policy. - "Refused to apply inline style ..." An inline
style=attribute or<style>block was blocked bystyle-srcfor the same reason. - "Refused to connect to ..." A
fetch,XMLHttpRequest, WebSocket, orEventSourcerequest was blocked byconnect-src. - "Refused to load the image ..." An image URL was blocked by
img-src. - "Refused to frame ..." An
<iframe>source was blocked byframe-src. - "Refused to evaluate a string as JavaScript ..." A call to
eval,new Function, or similar was blocked becausescript-srcdoes not include'unsafe-eval'. The fix is usually to remove theeval, not to add the keyword.
Inline script and eval violations are the two that catch people out, because they are not about an origin you forgot. They mean the policy is doing its job and the page is relying on inline execution. The right response is a nonce or a hash for the inline block you control, not 'unsafe-inline', which switches the protection back off for everything. The reasoning is in why you should never use unsafe-inline in CSP.
Map the message to the fix
Once you know the directive and the resource, the change is mechanical:
- A legitimate cross-origin resource was blocked. Add its exact origin to the directive the message named. If
connect-srcblockedhttps://api.example, add that origin toconnect-src. Add the specific origin, not a wildcard. - Your own inline script or style was blocked. Give it a nonce (a fresh per-response random value in the directive and on the element) or a hash. See get started with Content Security Policy for the nonce setup.
- An
evalwas blocked. Find the code that callsevalornew Functionand replace it. A dependency that needsevalis worth flagging; adding'unsafe-eval'weakens the whole policy. - You do not recognise the resource at all. That is the interesting case. An origin you did not add, on a page you did not change, can be an extension, or it can be an injected script. Do not allow it reflexively. Check the element link in the Issues panel to see where it came from.
If you want to confirm the change is sound before shipping it, the CSP evaluator scores a policy and flags weak sources, and MDN's CSP guide has the per-directive reference. After editing, reload with the Issues panel open and confirm the violation is gone.
DevTools only sees your machine
The Issues panel shows violations on your browser, on this page, in this session, with your extensions. That is exactly what you want while you are fixing one page. It is not what tells you the policy is safe to enforce for everyone.
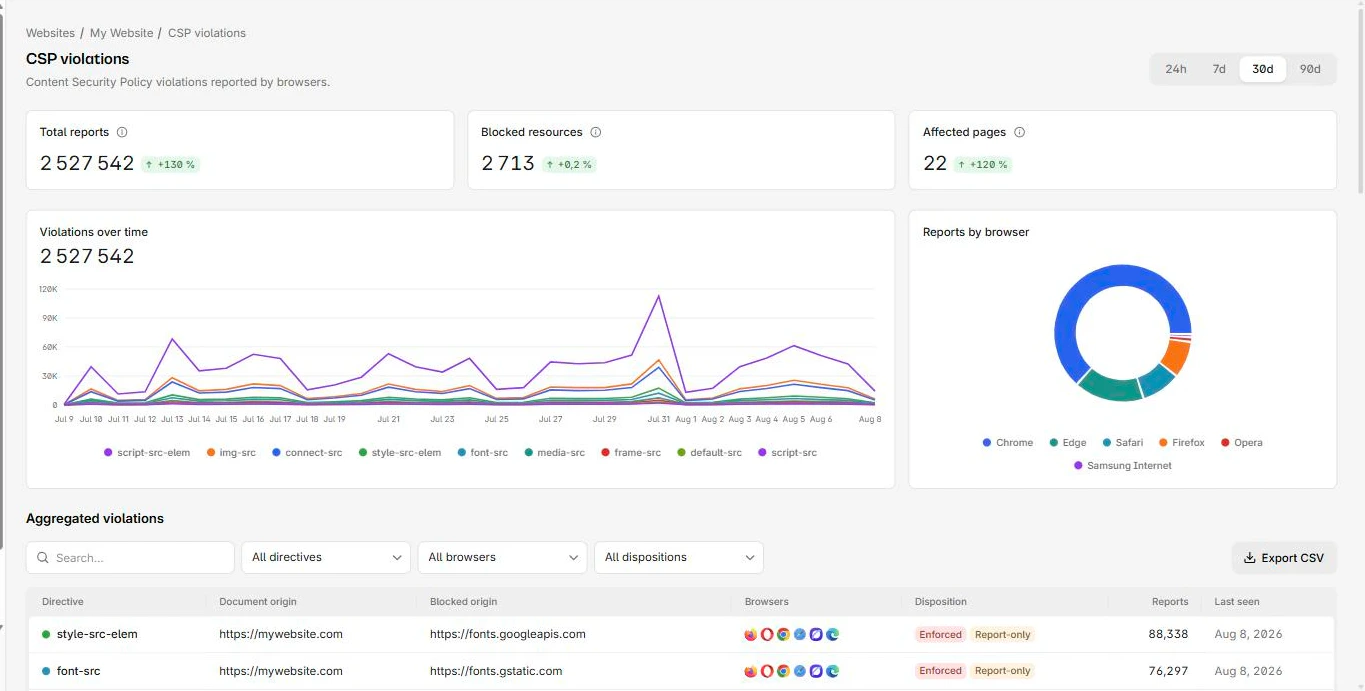
Real users hit violations you will never see locally: third-party scripts that only load in some regions, an extension you do not have, a page you did not test, a vendor tag that changed overnight. None of those show up in your DevTools. To enforce a policy without breaking the long tail, you collect violation reports from real traffic instead of relying on one machine. For what those reports contain and how the fields map to what you see in DevTools, see CSP violation report fields.
That collection is what the CentralCSP CSP suite does: it ingests the reports your real users generate, groups them by directive and origin, separates extension noise from genuine issues, and shows the scripts running on each page, so you debug from production evidence instead of a single browser tab. You can start a free trial, point a Report-Only header at it, and watch the violations arrive from real traffic.
Sources
- Chrome DevTools documentation
- Chrome DevTools, the Issues panel
- MDN, Content Security Policy guide
- W3C, Content Security Policy Level 3