What is NEL, network error logging from the browser
CentralCSP Team ·
Last update:
Your server logs have a blind spot: they can only record requests that reached your server. The requests that failed at DNS resolution, during the TLS handshake, or because the connection was reset never arrive, so you never log them, even though the user experienced an error. Network Error Logging (NEL) closes that gap. It asks the browser to report those client-side failures back to an endpoint you control, from the one place that can see them: the user's browser.
What NEL gives you
NEL collects the outcome of network requests, DNS failures, TLS and connection errors, resets, and HTTP error responses, and reports them to your endpoint. It is observability, not enforcement: it never blocks or changes a request, it just tells you what happened. That makes it the network-layer companion to policy reports like CSP, and the full reference is the NEL policy page.
The catch is the data lives on the client, so you only learn about failures from browsers that support NEL and only at the sampling rate you configure. Treat it as a broad early-warning signal, not a complete accounting of every failed request.
How to turn it on
NEL is the one reporting feature that still uses the legacy
Report-To header rather than
Reporting-Endpoints, so it takes two headers working together. Report-To defines
a named group and where it sends; the NEL header turns logging on, points at that
group, and sets the sampling rates.
Report-To: {"group":"nel-group","max_age":31536000,"endpoints":[{"url":"https://<Endpoint-ID>.report.centralcsp.com"}]}NEL: {"report_to":"nel-group","max_age":31536000,"include_subdomains":true,"failure_fraction":1.0}The two fractions control volume. Set failure_fraction to 1.0 to report every
failure, since failures are what you care about and are relatively rare. Keep
success_fraction at 0 or very low: a busy site has far more successes than
failures, and sampling them at any meaningful rate floods your endpoint.
max_age sets how long the browser remembers the policy, and include_subdomains
extends it across your subdomains.
What a report looks like
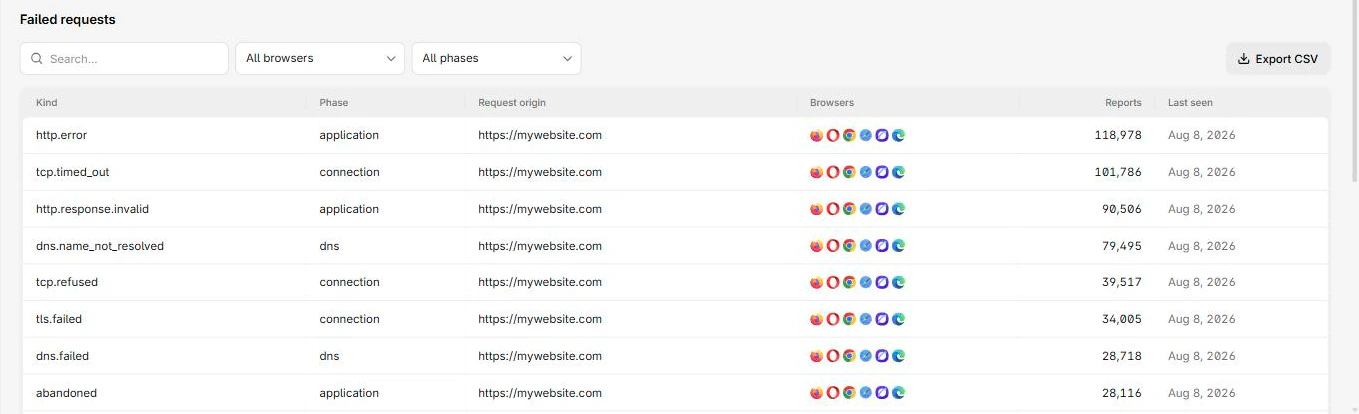
The browser sends a network-error report
that names the phase of the request that failed (dns, connection, or
application) and a specific error type, alongside timing and protocol details.
{
  "type": "network-error",
  "body": {
    "phase": "application",
    "type": "http.error",
    "status_code": 400,
    "protocol": "http/1.1",
    "server_ip": "192.0.2.172",
    "elapsed_time": 338
  }
}
The phase field is the quickest triage: a dns failure points at name resolution,
connection at TCP or TLS, and application at an HTTP-level error your server (or
a CDN in front of it) returned.
When it is worth it
NEL earns its place by surfacing problems your own monitoring cannot see: a TLS misconfiguration that only affects one region's CDN edge, a DNS issue at a particular resolver, or connection resets from a specific network. Because the reports come from real users, you find out about a broken edge before it shows up as a support ticket. A sudden spike of TLS or connection failures from one area can also be a sign of interception or a captive portal mangling traffic.
NEL is experimental and currently works only in Chromium-based browsers, Firefox and Safari do not implement it. Treat it as a useful signal from part of your traffic, not a complete picture.
Collect it without a backend
NEL reports use the same delivery mechanism as your other browser reports, so they
arrive in one stream. Point the Report-To endpoint at CentralCSP to
collect and chart network errors next to your CSP
and other reports, instead of standing up a separate pipeline just for NEL.
Next steps
- Understand the two reporting headers in Report-To vs Reporting-Endpoints.
- See the full network-error report.
- Set up reporting end to end: how to set up the Reporting API.
Monitor client-side network failures.