Monitoring
All browser signals, in one place.
Blocked scripts, failed connections, crashed tabs: browsers report them as real users browse. CentralCSP collects all of it with one response header.
How it works
From response header to alerts in your existing channels.
The pipeline between a visitor's browser and your team, end to end.
01 - Collect
Ship one header
Add Reporting-Endpoints at your CDN, proxy or framework. Legacy report-uri lands on the same endpoint.
02 - Process
Collected, deduped, classified
Browsers send reports in the background: visitors feel nothing. Every report is kept; duplicates group together and extension false positives get flagged.
03 - Act
Watch, alert, export
Filter the live feed, route alerts to your channels, pull the raw JSON over the API.
'%20gradientUnits='userSpaceOnUse'%3e%3cstop%20offset='0'%20style='stop-color:%235a62c3'/%3e%3cstop%20offset='.5'%20style='stop-color:%234d55bd'/%3e%3cstop%20offset='1'%20style='stop-color:%233940ab'/%3e%3c/linearGradient%3e%3cpath%20d='M21.8%20125h218.3c12.1%200%2021.8%209.8%2021.8%2021.8v218.3c0%2012.1-9.8%2021.8-21.8%2021.8H21.8C9.8%20387%200%20377.2%200%20365.2V146.8c0-12%209.8-21.8%2021.8-21.8'%20style='fill:url(%23microsoft-teams_svg__SVGID_1_)'/%3e%3cpath%20d='M188.4%20208.1h-43.6v118.8H117V208.1H73.5V185h114.9z'%20style='fill:%23fff'/%3e%3c/svg%3e)


'%20gradientUnits='userSpaceOnUse'%3e%3cstop%20offset='0'%20style='stop-color:%231d93d2'/%3e%3cstop%20offset='1'%20style='stop-color:%2338b0e3'/%3e%3c/linearGradient%3e%3ccircle%20cx='256'%20cy='256'%20r='256'%20style='fill:url(%23telegram_svg__a)'/%3e%3cpath%20d='m173.3%20274.7%2030.4%2084.1s3.8%207.9%207.9%207.9%2064.5-62.9%2064.5-62.9l67.3-129.9-169%2079.1z'%20style='fill:%23c8daea'/%3e%3cpath%20d='m213.6%20296.3-5.8%2062s-2.4%2019%2016.5%200c19-19%2037.2-33.6%2037.2-33.6'%20style='fill:%23a9c6d8'/%3e%3cpath%20d='m173.8%20277.7-62.5-20.4s-7.5-3-5.1-9.9c.5-1.4%201.5-2.6%204.5-4.7C124.6%20233.1%20367%20146%20367%20146s6.8-2.3%2010.9-.8c2%20.6%203.6%202.3%204%204.4.4%201.8.6%203.7.5%205.5%200%201.6-.2%203.1-.4%205.4-1.5%2023.8-45.7%20201.6-45.7%20201.6s-2.6%2010.4-12.1%2010.8c-4.7.2-9.3-1.6-12.6-4.9-18.6-16-82.8-59.2-97-68.6-.6-.4-1.1-1.1-1.2-1.9-.2-1%20.9-2.2.9-2.2s111.8-99.4%20114.8-109.8c.2-.8-.6-1.2-1.8-.9-7.4%202.7-136.2%2084.1-150.4%2093-.9.2-2%20.3-3.1.1'%20style='fill:%23fff'/%3e%3c/svg%3e)
Setup
The whole setup is one header.
Add Reporting-Endpoints to your responses and browsers start delivering every report type to your endpoint.
Have a CSP already? Point its report-to at the same endpoint and every violation lands there too.
Verify your setup
Is your site already reporting?
Free, no account needed. Results land on a shareable page.
The scan verifies
- Policy setup: which report types your headers request
- Endpoint setup: where reports are sent and if it responds
- Misconfigurations: what silently gets dropped today
Aggregation
A million reports become a short list of issues.
Raw reports stay stored and queryable, but you work from the aggregate: grouped, deduped and ranked so the real problem surfaces first.
What we collect
Twelve report types. Three reasons to want them.
Most tools stop at CSP violations. Browsers can report much more, and every type below lands on the same endpoint, parsed and searchable.
Attack signals
The reports that catch injected code, tampered files and data leaving the page.
csp-violationCSP violations
A resource loaded, or tried to, against your Content Security Policy. Works enforced or report-only.
View docscsp-hashScript hashes
The hash of every script your pages execute. Your script inventory, and your PCI DSS 6.4.3 evidence, sourced from real traffic.
View docsintegrity-violationIntegrity violations
A file no longer matches its Subresource Integrity hash. Either your build changed it, or someone else did.
View docsconnection-allowlistConnection Allowlist violations
An outbound connection left the page for an origin you never declared. This is how exfiltration gets noticed.
View docsFailures your server never logs
These happen before the request reaches you, or after the page is dead. Only the browser can report them.
network-errorNetwork errors
DNS failures, TLS errors and dropped connections, logged by the browser that experienced them.
View docscrashCrashes
The tab crashed or ran out of memory. A dead page can't run a monitoring script; the Reporting API is the only witness.
View docsdeprecationDeprecations
Your pages call an API the browser plans to remove, with the removal date when the browser knows it.
View docsinterventionInterventions
The browser changed your page's behavior on its own: an autoplay denied, a slow script throttled.
View docsPolicy hygiene
Proof that the isolation and permission policies you ship actually hold in production.
permissions-policy-violationPermissions Policy violations
Code asked for camera, geolocation or another gated feature against your Permissions-Policy.
View docsdocument-policy-violationDocument Policy violations
A page behavior broke the configuration your Document-Policy declares.
View docscoopCOOP violations
A cross-origin window interaction your Cross-Origin-Opener-Policy blocked or would block.
View docscoepCOEP violations
A resource loaded without the opt-in your Cross-Origin-Embedder-Policy requires.
View docsCoverage
Reports from every visitor, everywhere.
Your monitoring runs wherever your users are: every browser, every network, every country your traffic comes from.
Full Reporting-API support
All 12 report types over both header generations, on one endpoint. If a browser can send it, we collect it.
Real-time signal
Reports hit your feed moments after the browser sends them, already deduped and classified. Alert rules fire as it happens.
Built for scale
1.5 billion reports ingested and counting. A violation spike on your busiest day is when the feed matters most, so it never falls behind.
After collection
Collection is half the job.
What the platform does with the reports once they're parsed.
Live dashboard
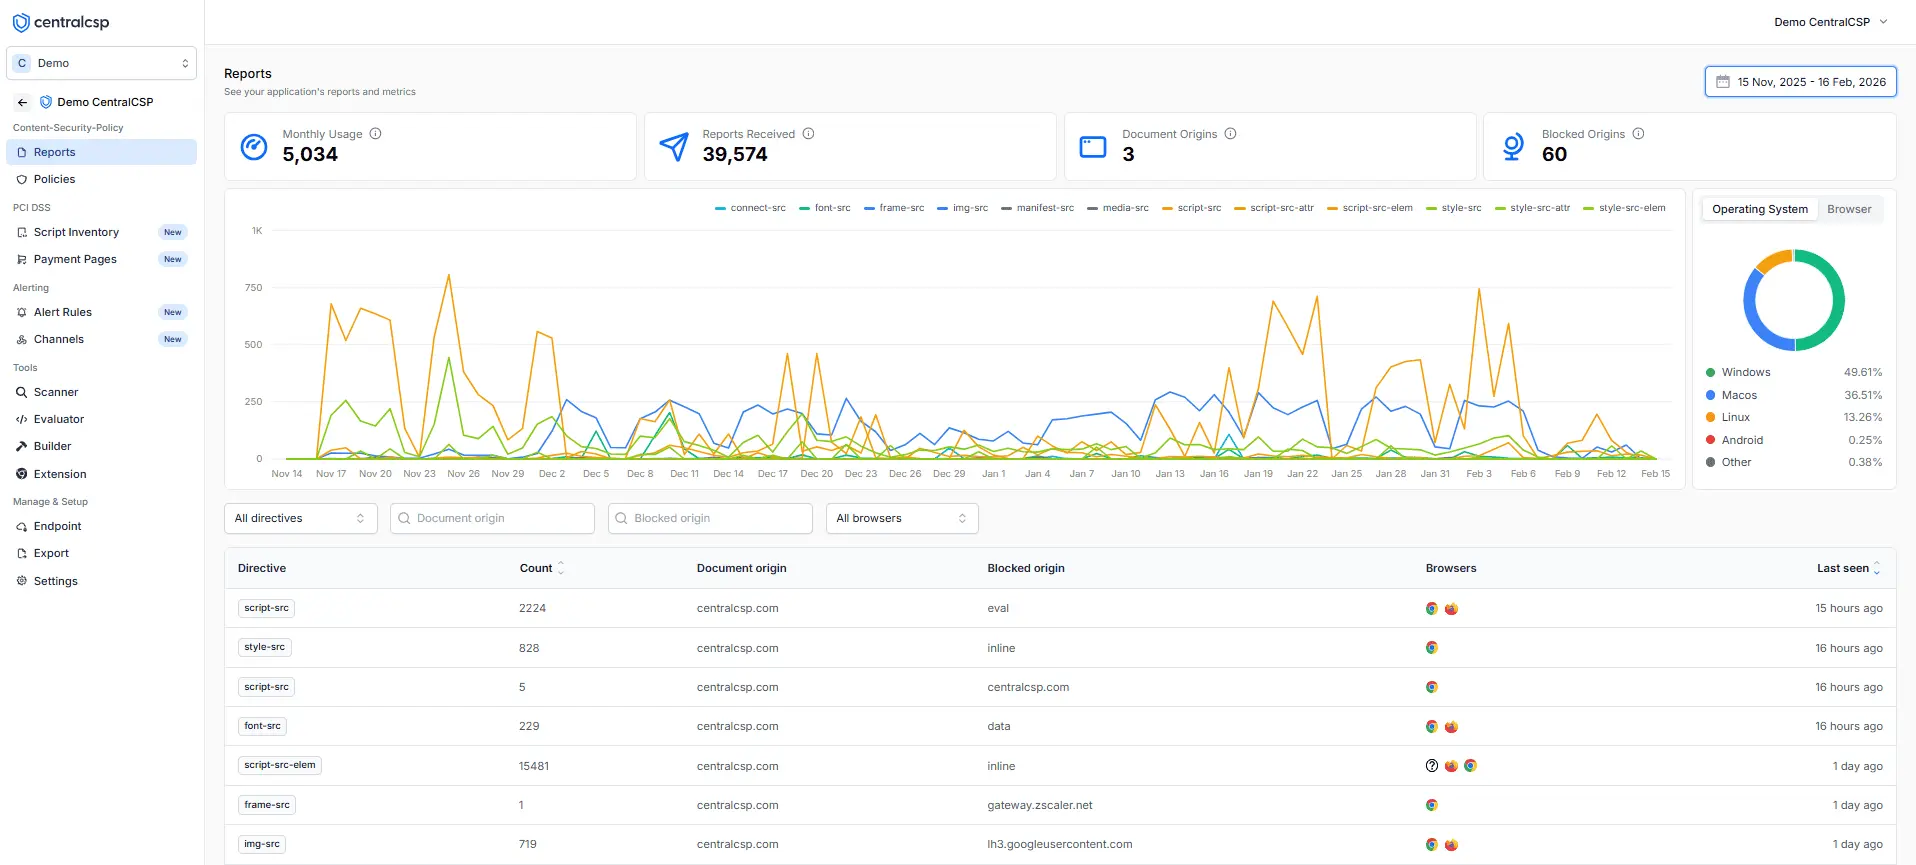
Filter the feed by report type, directive, browser or origin, and drill into any report's raw JSON.
- Feed filtered by type, directive, browser, origin
- Raw JSON for every report
- Per-site scores and inventories
Alert rules
New origin, hash change, violation spike: route what matters to the channels your team already uses.
- New-origin and hash-change rules
- Violation spike detection
- Slack, Teams, Google Chat, Telegram, email
API and MCP
Everything in the feed is queryable over the REST API, exportable as CSV, and drivable by AI agents over MCP.
- REST API with scoped tokens
- CSV and raw-report exports
- Built-in MCP server
CSP builder
Turn the collected violations into a Content Security Policy that fits your real traffic, then tighten it over time.
- Policy built from production reports
- Directive-by-directive suggestions
- Test in report-only first
PCI DSS evidence
The same reports feed a continuous script inventory of your payment pages, exported as auditor-ready evidence.
- Requirements 6.4.3 and 11.6.1
- Continuous script inventory
- Auditor-ready exports
Supply chain
Every script in your inventory is checked against known CVEs, so a compromised dependency doesn't stay quiet.
- Known CVEs flagged in your scripts
- New-script detection
- Fed by the same reports
FAQ
Frequently asked questions
Performance, privacy and browser support, answered.
Your next visitor can be your first report.
Add the header, watch the feed fill up with real traffic. 14-day free trial, no agent to deploy.