Browser crash and unresponsive reports, a client-side availability signal
CentralCSP Team ·
Last update:
When the browser tab running your page crashes, runs out of memory, or hangs, your analytics and error tracking go down with it. The page that would have phoned home is the page that just died, so the failure is invisible to every tool that runs inside it. Crash reports close that gap. The browser remembers that the page crashed and sends a report the next time it loads your origin, from outside the dead tab, giving you a client-side availability signal you cannot get any other way.
Limited availability
Crash reporting is implemented in Chromium-based browsers and is still evolving. Firefox and Safari do not send crash reports, so treat this as a signal from part of your traffic, not a complete count.
What a crash report tells you
A crash report records that the renderer
process hosting your page stopped working. The body carries a reason that explains
how it ended. Two reasons matter most:
oom, the renderer was killed because it ran out of memory.unresponsive, the page hung long enough that the browser gave up on it.
A crash with no specific reason is a plain renderer crash. In every case the report is about the process that ran your page, not your server. It is the browser telling you that, for this user, your page stopped functioning entirely.
Why delivery is delayed
A normal report can be sent while the page is alive. A crash report cannot, because the thing that would send it is exactly what failed. So the browser holds the report and delivers it later, the next time it loads your origin. The crash is recorded in one session and reported in the next.
That delay is the defining trait of crash reports, and it shapes how you read them. A spike does not line up with the minute the crashes happened, it lines up with when those users came back. Plan for lag, and never treat the count as real-time.
Like every report type, crash reports are not tied to a single policy, so they go to
the endpoint named default. Declare it once with
Reporting-Endpoints and the
browser routes crashes there automatically.
Reporting-Endpoints: default="https://<Endpoint-ID>.report.centralcsp.com"What a crash report looks like
{
  "type": "crash",
  "url": "https://api-next.centralcsp.com/checkout",
  "body": {
    "reason": "unresponsive"
  }
}
The body is deliberately small. By design a crash report carries no page content,
since the page is gone. Beyond the reason, Chromium can include is_top_level,
visibility_state, and crash_report_api flags, plus a JavaScript stack for hangs
(covered below). Paired with the url that was loaded, that is enough to answer the
question that matters: which pages are killing the tab, and how.
Add a call stack to unresponsive reports
For unresponsive crashes, Chromium can include a JavaScript call stack so you can
see where the page hung. You opt in with the
Document-Policy header
(Document-Policy explained) and the
include-js-call-stacks-in-crash-reports configuration point.
Document-Policy: include-js-call-stacks-in-crash-reportsWith it set, an unresponsive report can carry the JS stack of the code that was
running when the page froze, which turns "a page hung" into "this function hung". It
applies to unresponsive hangs, where there is a stack to capture, not to an oom
kill. Support is Chromium-only and recent.
Read it as an SRE and security signal
Crash reports are a thin signal, but a meaningful one when you watch the trend rather than the single event.
- Repeated
oomon one route points at a memory leak or an unbounded allocation on that page. A page that grows memory until the tab dies will show up here before it shows up anywhere else, because the crash kills your in-page monitoring. - A rise in
unresponsivereports means real users are hitting hangs, often a tight loop or blocking work on the main thread under conditions your test devices do not reproduce. The opt-in call stack tells you which code. - A sustained burst of either, especially concentrated on one origin or one endpoint, can also read as a denial-of-service signal: input or content that reliably exhausts memory or wedges the renderer is a client-side availability problem, not just a bug.
Pair the reason with the url and you have a short list of pages to harden, ranked
by how often they take a tab down.
Collect crashes without an in-page agent
The whole value of a crash report is that it arrives from outside the failed page, so
it needs a destination that is always there to receive it. CentralCSP ingests every
browser report type, so pointing your default endpoint at it
collects crash and unresponsive reports alongside your
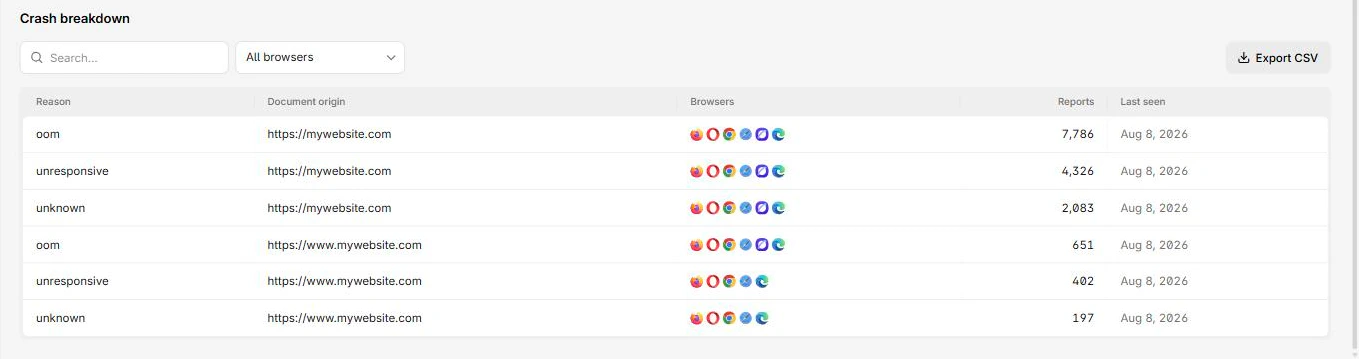
CSP, NEL, and deprecation reports, grouped by url and reason so a leaking route or
a spreading hang stands out. You watch client-side availability from the same place
you watch your security reports, with no agent running in the tab that just died.
Next steps
- Wire the endpoint first: how to set up the Reporting API.
- Read the crash report reference.
- Turn on call stacks with Document-Policy.
Watch client-side availability from real traffic.
Sources
- Crash Reporting on MDN
- Reporting API specification (W3C)
- Monitor your web application with the Reporting API on Chrome for Developers