ReportingObserver, catch deprecations and CSP violations in JavaScript
CentralCSP Team ·
Last update:
Most of the Reporting API ships browser reports off to a server you control. The
ReportingObserver API does the opposite: it hands those same reports to your own
JavaScript, inside the page, the moment they fire. No response header, no endpoint, no
backend. You construct an observer, give it a callback, and the browser starts calling
you with deprecation warnings, browser interventions, and (where supported) CSP
violations as they happen. It is the in-page counterpart to endpoint reporting, and it
slots straight into a front-end error pipeline you already run.
What it observes
ReportingObserver
is a constructor available in the page's own JavaScript. You point it at the report
types you care about and it delivers matching reports to your callback. It covers:
deprecation, an API your page uses is slated for removal.intervention, the browser overrode something your code asked for.- CSP violations, where the browser surfaces them through this interface.
These are the same events the browser would otherwise batch and POST to a server. The difference is where you read them: in the page, in real time, with the full report object in hand. The observer surfaces deprecation, intervention, and CSP violation reports; crash reports never reach it and go only to a server endpoint. Of the three it does surface, CSP violation delivery is the least consistent across browsers, so confirm it in your target browsers before depending on it.
Wire one up
You create the observer with a callback and an options object. The callback receives a
list of reports and the observer itself. The two options that matter are types, the
report types to watch, and buffered, which replays reports that fired before your
observer existed so you do not miss early ones during page load.
const = new (
(, ) => {
for (const of ) {
// report.type is "deprecation", "intervention", or "csp-violation"
// report.body holds the type-specific fields
({
: .,
: .,
: .,
});
}
},
{ : ["deprecation", "intervention"], : true }
);
.();Call observe() to start. The buffered: true flag is what makes this reliable: a
deprecation can fire while your bundle is still parsing, and without buffering you
would never see it. With it, those early reports are replayed into your first
callback.
Fit it into a front-end error pipeline
If you already capture JavaScript errors and unhandled rejections in the browser and
ship them to a logging service, ReportingObserver is one more source for that same
pipeline. Treat each report like an error event: tag it with the type, attach the
source location from report.body, and send it through the channel you already have.
function sendToErrorPipeline(entry) {
  // reuse your existing client logger / beacon
  navigator.sendBeacon("/client-logs", JSON.stringify(entry));
}

window.addEventListener("error", (e) =>
  sendToErrorPipeline({ type: "js-error", message: e.message })
);

new ReportingObserver(
  (reports) => reports.forEach((r) =>
    sendToErrorPipeline({ type: r.type, body: r.body })
  ),
  { types: ["deprecation", "intervention"], buffered: true }
).observe();
Using sendBeacon keeps the report from being dropped when the user navigates away,
the same reason the Reporting API delivers out of band. Now a deprecation shows up in
the same dashboard as a thrown exception, with the source file and line that
triggered it.
It complements endpoint reporting, it does not replace it
ReportingObserver and endpoint-based reporting answer different questions, so most
teams want both.
- The observer runs only while your page is alive and only sees what this session produces. It is great for real-time front-end telemetry and for routing reports into tooling you already own.
- Endpoint reporting, declared with the
Reporting-Endpointsheader, keeps working when the page is gone, aggregates across all your traffic, and catches report types the observer does not, like crash reports. That is the authoritative, server-side view.
Use the observer to surface issues fast in your own front-end stack, and use endpoint reporting as the durable record. Set up the endpoint side in how to set up the Reporting API, and read the full catalog of report types on the reports reference. The mechanics of the observer itself are on the ReportingObserver concept page.
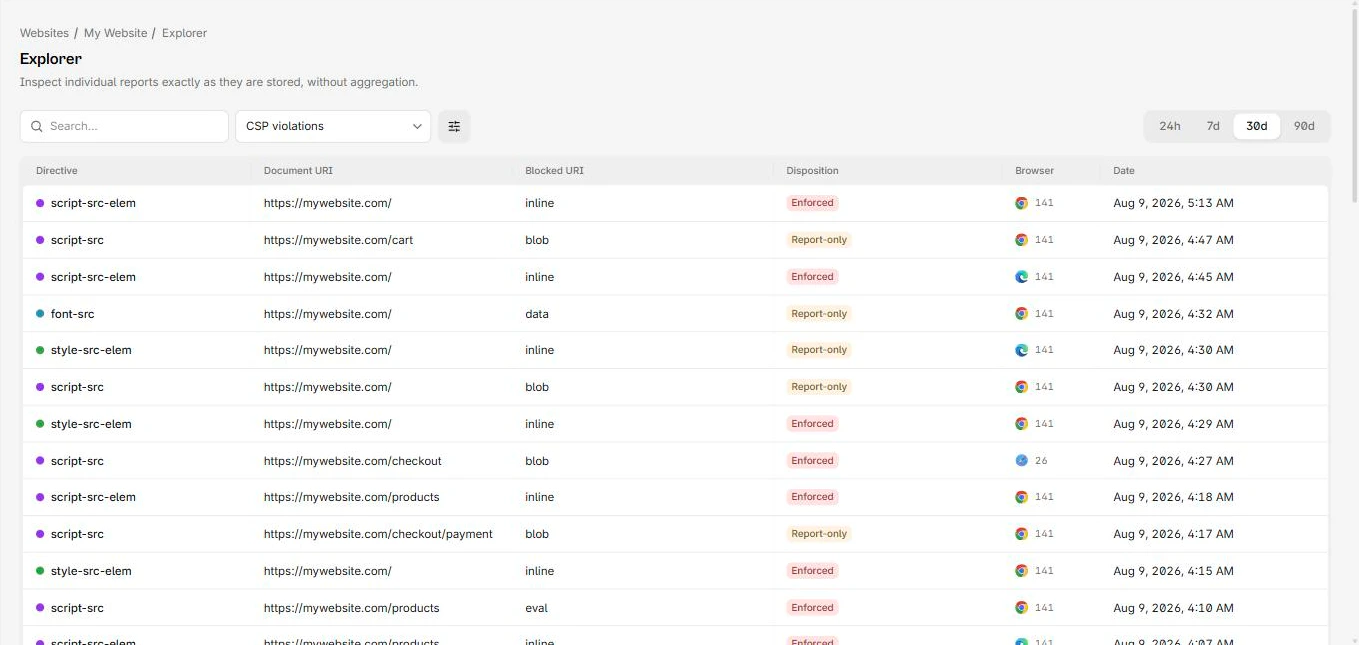
Send both views to one place
The observer gives you reports in the browser; the endpoint gives you reports from
real traffic. CentralCSP ingests every browser report type on the endpoint side, so
your ReportingObserver and your Reporting-Endpoints configuration can
feed the same reporting view, with deprecations,
interventions, and CSP violations grouped and trended instead of scattered across a
console and a log file. You get the real-time front-end signal and the durable,
cross-traffic record without building two pipelines.
Next steps
- Set up the endpoint side: how to set up the Reporting API.
- Browse every report type and what each tells you.
- Read the ReportingObserver concept page.
Collect every browser report in one place.