

Explorer
Inspect individual browser reports with no aggregation. Pick a type, apply per-type facet filters, and read the stored JSON a browser actually sent.
Last update:
The Explorer shows one row per report with nothing grouped. Use it to confirm a specific event or read a raw payload. For finding patterns, use the per-type pages instead.
Find it under the website's Reports > Explorer.
Pick a type first
The Report type dropdown lists the types your plan includes and defaults to CSP violations. Changing it changes the table columns, because a crash and a CSP violation share almost no fields.
| Type | Columns |
|---|---|
| CSP violations | Directive, Document URI, Blocked URI, Disposition, Browser, Date |
| CSP hashes | Document URI, Subresource URI, Hash, Destination, Browser, Date |
| Integrity violations | Document URI, Blocked URI, Destination, Disposition, Browser, Date |
| Permissions Policy, potential Permissions Policy, Document Policy | Policy, Source file, Message, Disposition, Browser, Date |
| Connection allowlist | Connection, Document URI, Disposition, Browser, Date |
| Everything else | Report URL, Message, Browser, Date |
Date includes the time here, which the aggregated pages omit. That is usually why you came.
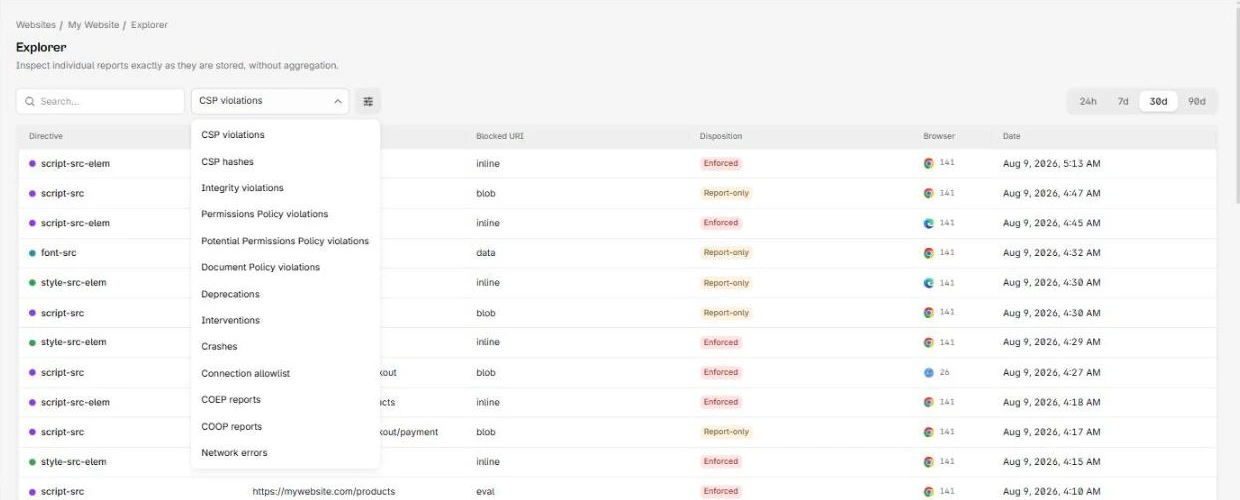
The report type dropdown lists every type:
Filter
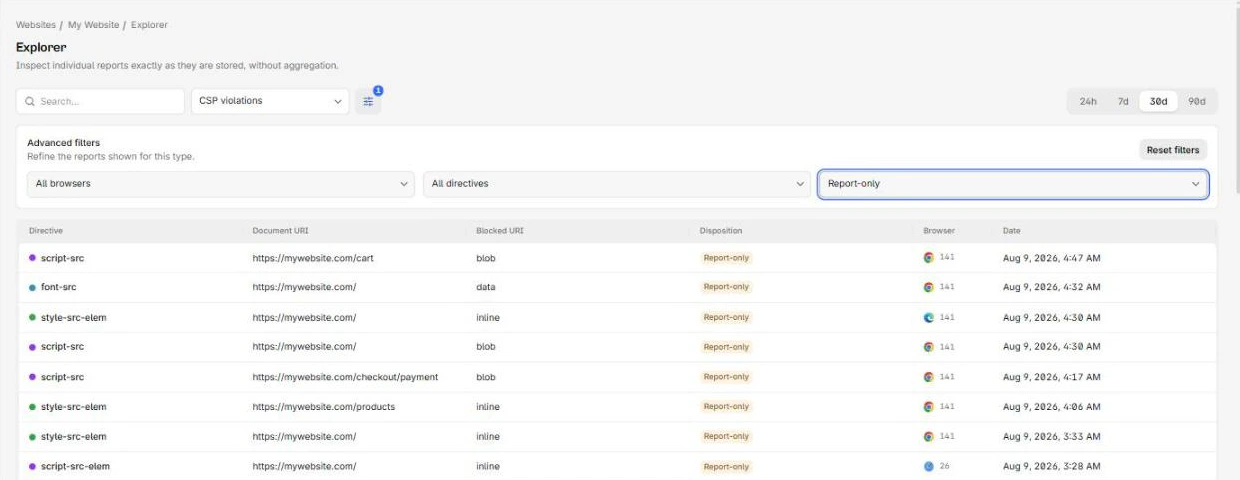
Advanced filters narrow the table further, and you can reset them in one action.
The available filters are fetched from the values present in your data for that type, so you are picking from what exists rather than from a fixed list. Depending on type you get some combination of browser, directive, disposition, destination, hash algorithm, policy, visibility, kind, and phase.
Set the range before filtering
Changing the time range clears every advanced filter. Choose the range first, then filter, or you will lose the selection you just made.
Filters here are independent of the aggregated pages. Arriving from a filtered CSP violations page does not carry that filter over.
Expanding the advanced filters adds a count badge and a reset control:
Read one report
Each report carries its type, id, received-at, report URL, browser, and operating system, plus the full stored JSON.
The JSON is the payload after ingestion filters ran. If you turned on Drop query strings and fragments or Drop referrer, those values are already gone here rather than hidden at display time. For more information, refer to Ingestion filters.
No export
The Explorer has no CSV export by design. Use the API to pull raw reports at volume.